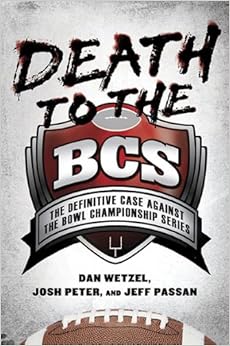
The current system set up by the FBS conference commissioners is a decent start. It's a definite improvement over the garbage that was the BCS. If you think the BCS wasn't all that bad, go read the book pictured to the left authored by Dan Wetzel, Josh Peter, and Jeff Passan, then come back and tell me with a straight face that the system was all right. If you do, I will call you a liar, because the BCS was a joke.
And that's what inspired an idea by these three men: building a more equitable playoff for college football, like what is run in the lower divisions of the NCAA. That's basically what I aim to build here.
If you missed my season introductory post where I explained their playoff system, here's the CliffNotes version: 16 teams (all ten conference champions plus six at large) seeded 1-16, with home field advantage granted to the higher seeds for the first three rounds. In their system they had a selection committee, which is a role I've taken by proxy for several years now, and tried to build a bracket based on their specifications.
To do that, I use a number of metrics. To a minor degree, Non-Conference Schedule Strength (NCSS) gets factored in, though its impact is minimal when it comes to filling and seeding the field. More important are First Degree, Second Degree, and Adjusted Playoff Points (PP1, PP2, and aPP, respectively), which dig beyond the won-loss record to get an idea of just how good a team actually is.
Now, I don't want to appear biased, so I also use computer rankings to help me determine if I'm making the right choices, but the computer rankings need to be good. I have found three that factor in margin of victory, which is kind of important when we're trying to figure out how good teams actually are. For the purposes of the Death to the BCS Playoffs, I use Jeff Sagarin's (SAG) model, the late David Rothman's (ROTH) model as compiled by a UCLA faculty member, and the rankings from All My Sports Teams Suck (AMSTS). Currently the Rothman model has no data for 2017, so I'm sticking with just the Sagarin and All My Sports Teams Suck models for now, which is enough to start.
These factors all kind of organically combine to build the field of 16, which will be built out below.
- Clemson (6-0, ACC "Champion")- NCSS: 3, PP1: 21, PP2: 5.50, aPP: 21; SAG: 3, ROTH: N/A, AMSTS: 1
- Alabama (6-0, SEC "Champion")- NCSS: 4, PP1: 17, PP2: 4.50, aPP: 17; SAG: 1, ROTH: N/A, AMSTS: 2
- Georgia (6-0, At Large)- NCSS: 2, PP1: 17, PP2: 5.17, aPP: 17; SAG: 5, ROTH: N/A, AMSTS: 6
- Washington State (6-0, Pac 12 "Champion")- NCSS: 1, PP1: 14, PP2: 5.67, aPP: 14; SAG: 15, ROTH: N/A, AMSTS: 5
- Washington (6-0, At Large)- NCSS: 3, PP1: 11, PP2: 1.67, aPP: 11; SAG: 6, ROTH: N/A, AMSTS: 8
- TCU (5-0, Big 12 "Champion)- NCSS: 3, PP1: 13, PP2: 3.60, aPP: 13; SAG: 16, ROTH: N/A, AMSTS: 3
- Wisconsin (5-0, Big Ten "Champion)- NCSS: 4, PP1: 12, PP2: 2.80, aPP: 12; SAG: 7, ROTH: N/A, AMSTS: 9
- USC (5-1, At Large)- NCSS: 3, PP1: 15, PP2: 5.40, aPP: 15; SAG: 12, ROTH: N/A, AMSTS: 10
- UCF (4-0, At Large)- NCSS: 4, PP1: 12, PP2: 4.00, aPP: 12; SAG: 21, ROTH: N/A, AMSTS: 17
- San Diego State (6-0, Mountain West "Champion")- NCSS: 5, PP1: 12, PP2: 3.83, aPP: 12; SAG: 36, ROTH: N/A, AMSTS: 16
- Miami (Florida) (4-0, At Large)- NCSS: 0, PP1: 9, PP2: 2.75, aPP: 9; SAG: 13, ROTH: N/A, AMSTS: 14
- Navy (5-0, American Athletic "Champion")- NCSS: 3, PP1: 10, PP2: 2.80, aPP: 10; SAG: 53, ROTH: N/A, AMSTS: 20
- South Florida (5-0, At Large)- NCSS: 3, PP1: 7, PP2: 1.40, aPP: 7; SAG: 38, ROTH: N/A, AMSTS: 22
- Western Michigan (4-2, MAC "Champion)- NCSS: 6, PP1: 7, PP2: 2.00, aPP: 5; SAG: 62, ROTH: N/A, AMSTS: 48
- North Texas (3-2, Conference USA "Champion)- NCSS: 4, PP1: 6, PP2: 3.33, aPP: 2; SAG: 107, ROTH: N/A, AMSTS: 72
- Louisiana-Monroe (3-2, Sun Belt "Champion")- NCSS: 6, PP1: 4, PP2: 0.67, aPP: 1; SAG: 124, ROTH: N/A, AMSTS: 81
 |
| Photo by Alex Gallardo (AP) |
 |
| Photo by Rainier Ehrhardt (AP) |
Again, I'll go into more detail in subsequent weeks, but that's the general idea. The conference "champions" in each of these will usually be the team with the best record, or the last remaining undefeated team. As some of these unbeatens play each other it will whittle down the rankings a little bit, and open things up for other one-loss teams, or even two-loss teams by the time all is said and done. I think the most losses an at large has ever gotten in with is three, and that's as bad as I'd be willing to put in an at large team.
 |
| Cartoon by Rob Tornoe (Philly Enquirer) |
That's it for Week 6! Tomorrow morning I'll be back with a look at the Week 7 non-conference schedule.

No comments:
Post a Comment